Automated Operations Dashboards and Alerting for Manufacturers
Turning plant-floor and ERP data into dashboards that surface problems before a shift supervisor has to go looking for them.

Summary
An automated operations dashboard for a manufacturer pulls live data from production systems, the ERP and plant-floor equipment into a single view, and pairs it with alerting that notifies a named person when a metric crosses a threshold that matters. The distinguishing feature is not the charts — it is that the system decides what deserves attention, rather than leaving that judgement to whoever happens to be looking at the screen.
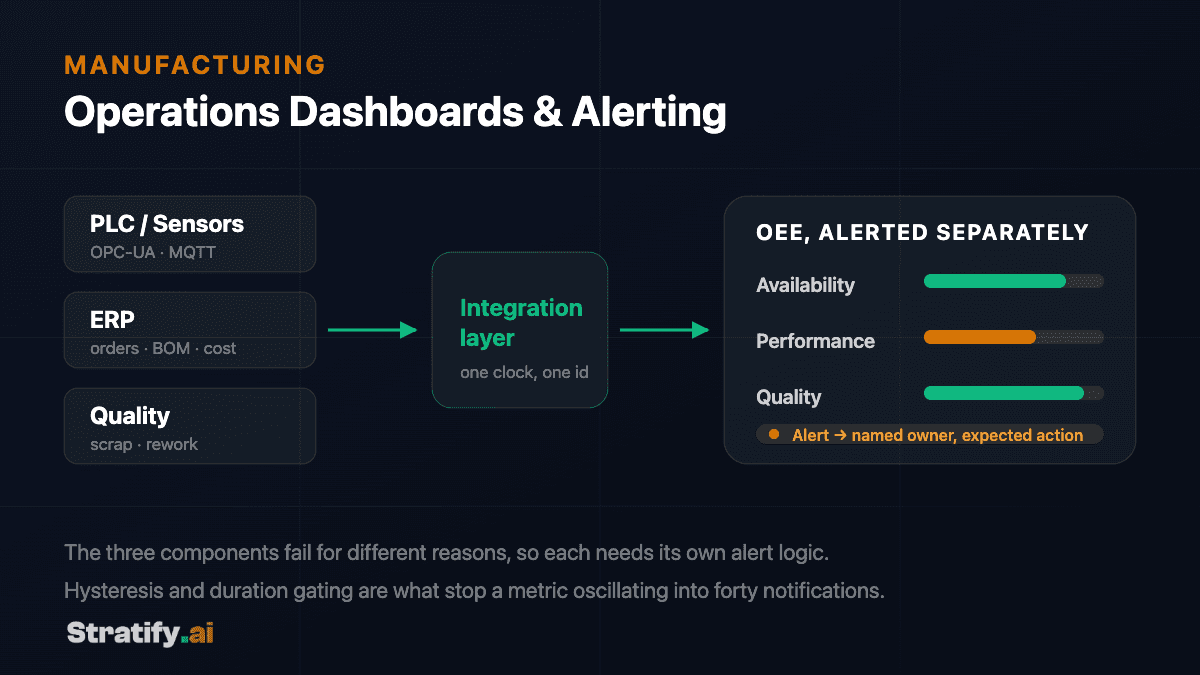
- Alert the components
- Not composite OEE — the three parts fail for different reasons
- Hysteresis + gating
- What stops a metric oscillating into forty notifications
- Owner and action
- Required on every rule, or it is a status update
- Rules over models
- AI earns anomaly detection, not working thresholds
Key takeaways
- Most manufacturing reporting is retrospective: it explains a bad shift after the shift has ended. Alerting moves the same data forward in time.
- The hard problem is not collecting data, it is deciding what constitutes an exception — and doing so without generating so many alerts that people stop reading them.
- OEE is the standard frame, but its three components fail for different reasons and need different alert logic.
- An alert with no named owner and no expected action is noise wearing the costume of information.
- AI earns its place in anomaly detection and natural-language querying, not in replacing deterministic threshold rules that already work.
The problem with manufacturing reporting
Most manufacturers are not short of data. Production systems record output. The ERP holds orders, inventory and cost. Machines emit signals continuously, often to a historian nobody queries directly. The gap is rarely collection — it is that the data arrives somewhere a person has to deliberately go and look, usually the morning after the moment when the information would have been useful.
The typical result is a weekly or monthly report cycle. A report explains that scrap was elevated on line 3 last week. By then the cause has been buried under a week of subsequent production, the operators who were present have rotated, and the investigation starts from a cold trail. The reporting is accurate and almost useless.
An operations dashboard with alerting inverts that. The same data is assembled continuously, and the system pushes a notification when something crosses a boundary that a human defined in advance. The report still gets produced — but it is no longer the first time anyone learns there was a problem.
What the data layer actually has to do
Manufacturing data arrives in fundamentally different shapes, and treating them uniformly is the most common architectural mistake. Machine telemetry is high-frequency time-series. ERP records are transactional and comparatively slow. Quality data is often event-driven and sometimes still manual. Each needs a different ingestion path and a different retention policy.
In practice this means the integration layer does three jobs: it reads from each source through an interface that survives that system being upgraded, it reconciles identifiers so a work order in the ERP can be joined to the machine cycles that produced it, and it maintains a consistent notion of time across sources whose clocks and time zones may not agree.
That last point sounds trivial and is not. A dashboard that joins a shift boundary recorded in local time to telemetry stamped in UTC will misattribute output at every shift change, and the error is invisible until someone reconciles a total by hand.
- Plant-floor telemetry
- PLC and sensor data over OPC-UA or MQTT, typically buffered locally so a network interruption does not create a permanent gap in the record.
- ERP transactional data
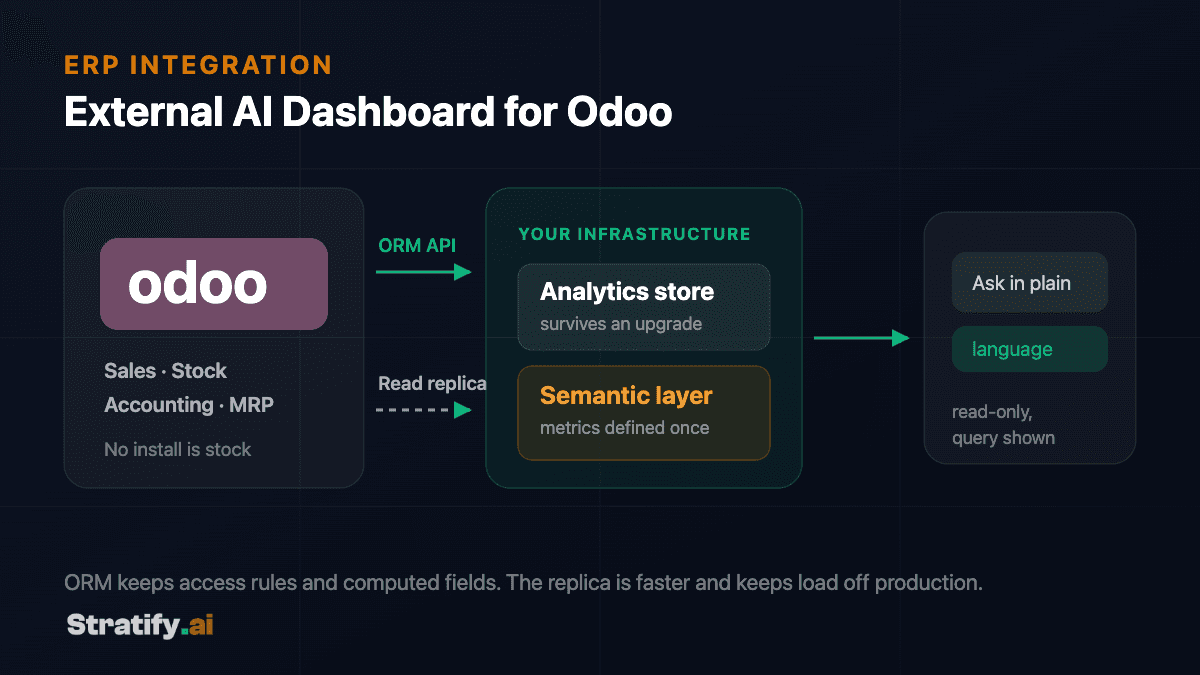
- Work orders, BOMs, inventory movements and cost, read through the ERP's own API or a read replica rather than by writing to its tables.
- Quality and inspection records
- Often the least structured source, and frequently the one that has to be modelled first because scrap and rework are what the alerts are ultimately about.
- Maintenance history
- Needed to distinguish planned downtime from a failure, without which availability figures are meaningless.
OEE, and why one number is not enough
Overall Equipment Effectiveness is the conventional frame: availability multiplied by performance multiplied by quality. It is a useful summary and a poor alert trigger, because a single OEE figure can decline for three unrelated reasons that call for three different responses.
Availability drops when equipment is not running when it should be — a breakdown, a changeover overrunning, a material shortage upstream. Performance drops when equipment runs slower than its rated cycle, which is often a gradual drift rather than a discrete event. Quality drops when output has to be scrapped or reworked, and this is the component most likely to have a root cause somewhere other than the machine reporting it.
Alerting on composite OEE therefore tells someone that something is wrong without indicating what. The more useful pattern is to alert on the components, with thresholds and recipients set separately for each, and to reserve the composite figure for the dashboard view where a human is already reading context.
Designing alerts people do not learn to ignore
Alert fatigue is the failure mode that kills these systems, and it is nearly always self-inflicted. A system that fires forty notifications a shift trains its recipients to dismiss all forty, including the one that mattered. Once that habit forms it is very hard to reverse, which means the alerting rules deserve more design attention than the dashboards do.
Three mechanisms do most of the work. Hysteresis — requiring a metric to move meaningfully back inside the limit before the alert can fire again — stops a value oscillating around a threshold from generating a stream of notifications. Duration gating means a condition must persist before it is treated as real, which filters transients. Aggregation rolls repeated instances of the same condition into one notification with a count, rather than one notification each.
Beyond the mechanics, there is a discipline question. Every alert should name the person or role expected to act, and state what action is expected. An alert that arrives with neither is a status update, and status updates belong on a dashboard, not in someone's notifications.
- Every alert has an owner
- A role, not a distribution list. Alerts sent to everyone are acted on by no one.
- Every alert has an expected action
- If nobody can say what the recipient should do differently, the condition does not warrant an alert.
- Escalation is time-based
- Unacknowledged alerts move up a defined path rather than repeating at the same level indefinitely.
- Rules are reviewed on a schedule
- Thresholds set at commissioning drift out of relevance as the process changes. Reviewing which alerts fired and which were acted on is how the rule set stays honest.
Where AI belongs, and where it does not
A threshold rule that already works does not need replacing with a model. Deterministic rules are transparent, cheap, and explicable to an auditor — properties worth preserving. The case for AI in this setting rests on the problems deterministic rules handle badly.
Anomaly detection is the clearest example. Some failure signatures are not a single metric crossing a line but a combination of readings that is individually normal and jointly unusual: a modest temperature rise together with a small cycle-time increase and a change in vibration. Writing a rule for that combination requires knowing about it in advance. A model trained on normal operation can flag the departure without anyone having anticipated the specific pattern.
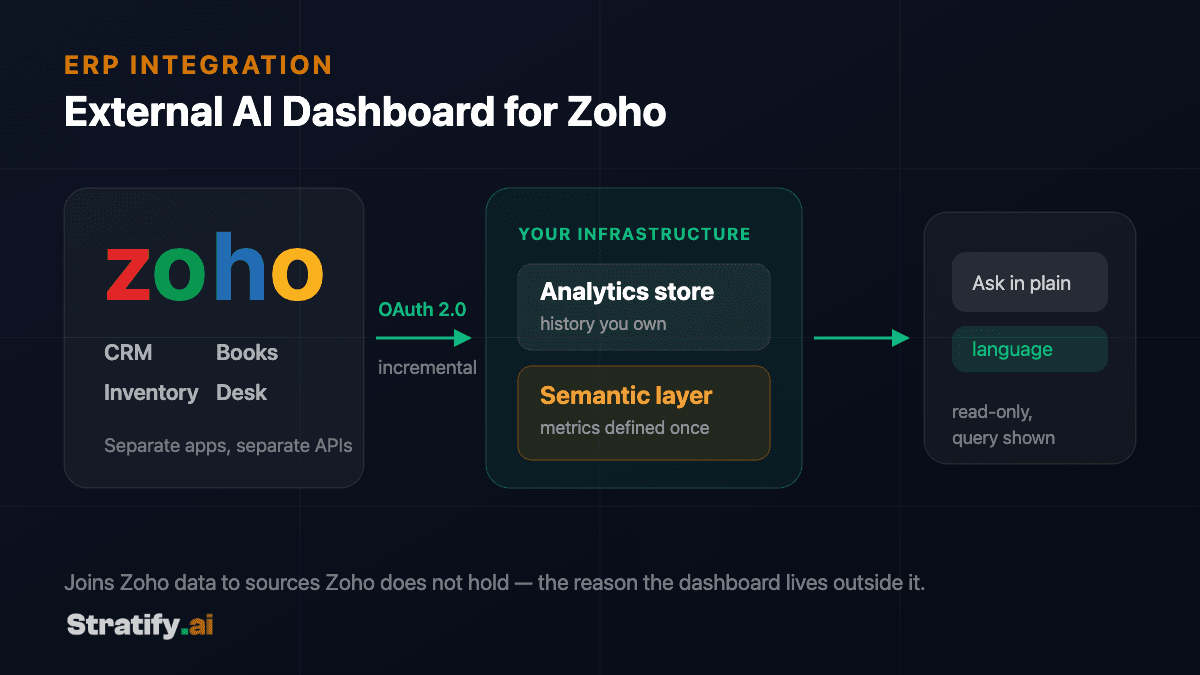
The second application is querying. A supervisor who wants to know which product codes drove scrap on the night shift last Tuesday should not have to file a request with a reporting team. Natural-language querying over a properly modelled dataset turns that into a question, which is the subject of the companion papers on ERP-connected dashboards.
The third is forecasting: projecting when a consumable will be exhausted or a maintenance window is due, based on observed rate rather than a fixed calendar. This is where a model's output should be treated as a prompt for a human decision rather than an instruction, because the cost of a false positive — pulling equipment for unnecessary maintenance — is real.
A realistic implementation sequence
The failure pattern with dashboard projects is attempting complete coverage before anything is in use. Six months of integration work delivered as a single release arrives to an audience whose questions have changed, and whose confidence in the numbers has never been tested incrementally.
A more reliable sequence starts with one line or one cell, one set of metrics, and a small group of users who will say plainly when a number looks wrong. Getting the data model right for a narrow scope is what makes expansion cheap; getting it wrong broadly is what makes these projects stall.
Alerting should follow the dashboard rather than launch alongside it. Until people have watched the metrics for a few weeks, nobody knows what normal looks like, and thresholds set before that are guesses. Adding alerting once the baseline is understood produces a far smaller and more useful rule set.
Where the same data has to be reachable by question rather than by chart, the companion papers on connecting an external dashboard to Zoho and Odoo cover the semantic layer and query guardrails that makes that safe. Building the reporting layer itself is described under AI application development.
OEE, and why one number is not enough
The three OEE components, their typical failure modes, and the alerting approach suited to each.
| Component | Typical cause of decline | Suited alert logic |
|---|---|---|
| Availability | Breakdown, overrunning changeover, upstream material shortage. | Threshold on unplanned stop duration, fired once the stop exceeds a set time rather than at every stop. |
| Performance | Gradual cycle-time drift, minor stops too short to be logged individually. | Statistical — a sustained deviation from the recent baseline, not a fixed number. |
| Quality | Process drift, material variation, tooling wear, upstream defect passed downstream. | Control-limit breach on the measured characteristic, ideally before the part is out of tolerance. |
Frequently asked questions
No. The dashboard reads from those systems through their existing interfaces; it does not become the system of record. Replacing a working MES to add reporting inverts the cost of the problem.
Older equipment often has more available signal than expected — PLC registers, existing counters, or a historian already collecting data nobody queries. Where a machine genuinely emits nothing, retrofit sensors for the specific measurements that matter are usually a smaller project than replacing the asset. What matters is deciding which measurements justify the retrofit before buying hardware.
By treating the rule set as a product that gets reviewed rather than a configuration that gets set once. Practically: hysteresis and duration gating to suppress oscillation and transients, a named owner and expected action for every rule, and a periodic review of which alerts fired versus which were acted on. Rules with a persistently low action rate should be retired.
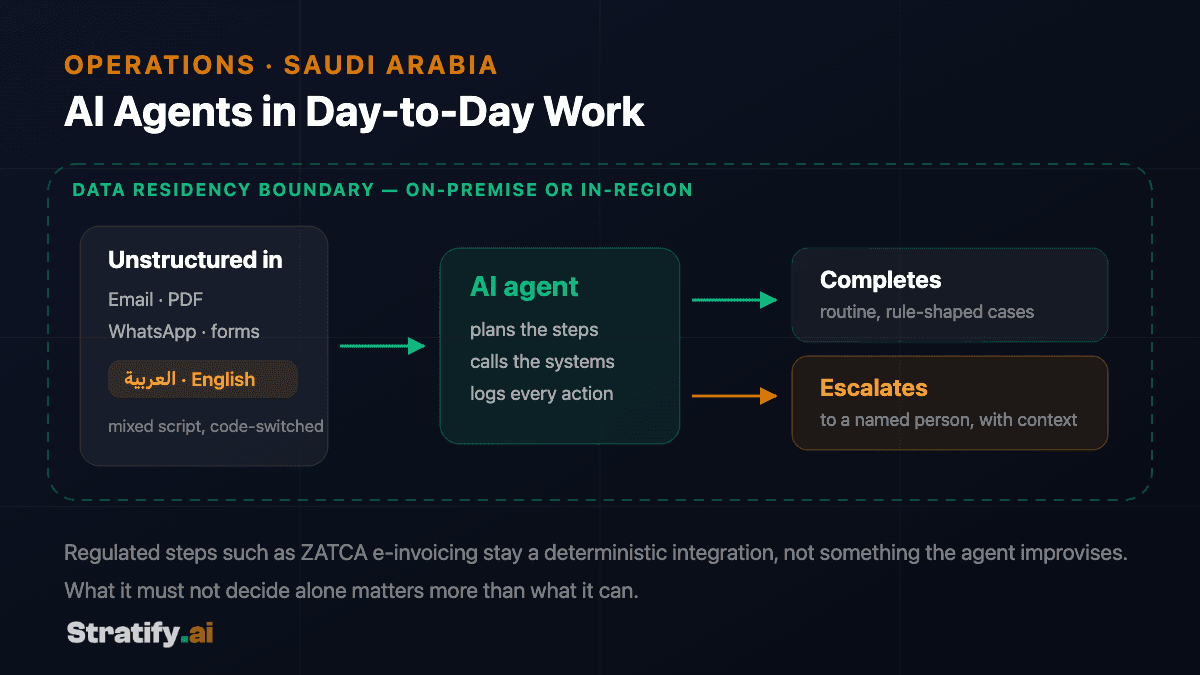
Yes. The processing and storage can sit on-premise, with models deployed locally where required. For manufacturers with data residency obligations or a policy against production data leaving the site, this is a design decision made at the start, because it shapes the infrastructure and model choices.
A narrow first deployment — one line, a defined metric set — is typically usable well before a full rollout is complete, which is the argument for scoping it that way. The variable that moves the timeline most is how accessible the source systems are, not how many dashboards are required.

Let's Build the Future
of Enterprise AI
Have a project in mind or need expert guidance?
We'd love to hear from you.
Salah Ad Din Al Ayyubi Rd, Al Malaz,
Riyadh 12836, Saudi Arabia
Global Enterprise Partner
Empowering businesses across North America, Europe, Asia, and the Middle East.